MyLens AI Review 2026: Interactive Visuals
We’re drowning in information. Between PDFs stacking up in our downloads folder, YouTube videos we’ve bookmarked for “later,” and web articles we never quite finish reading, the challenge isn’t finding content—it’s making sense of it all.
I spent the last three weeks testing MyLens AI with everything from 80-page research reports to technical documentation, and the results genuinely surprised me. In one case, I transformed a 45-page market analysis report into a comprehensive mind map in under 90 seconds. What would have taken me hours to manually outline and structure happened almost instantly.
But here’s what really matters: Is this tool worth your time and money? Let me break down everything I’ve learned from hands-on testing.
What is MyLens AI?
MyLens AI is an AI-powered visualization platform that converts complex content into interactive visual formats. Think of it as a translator—but instead of converting between languages, it translates dense information into visual structures your brain can process faster.
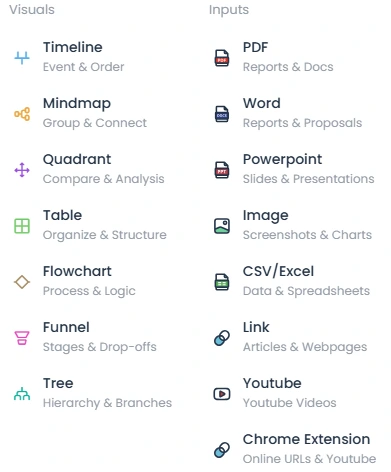
The platform handles multiple input formats including PDFs, webpages, YouTube videos, images, long texts, and CSV/Excel files, then uses AI to generate mind maps, timelines, flowcharts, comparison charts, and tables.
During my testing, I threw various content types at it:
- A 30-minute YouTube tutorial on machine learning
- A quarterly business report (52 pages)
- A Wikipedia article on blockchain technology
- Raw project planning data from Excel spreadsheets
Each time, MyLens extracted the core concepts and relationships, presenting them in visual formats that made comprehension significantly faster.
Key Features: What MyLens AI Actually Does
Multi-Source Input Capability
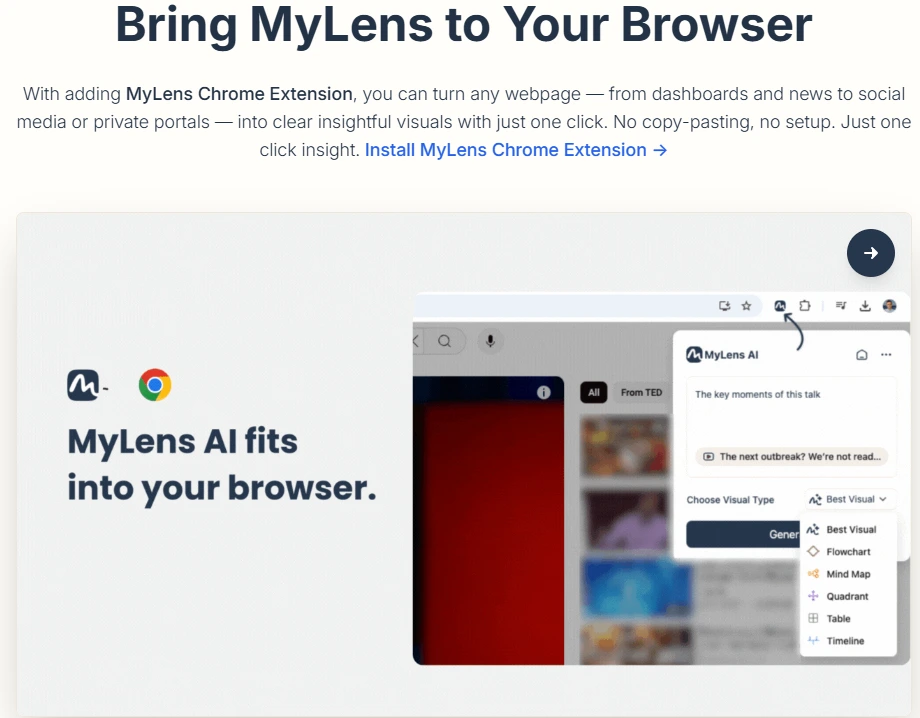
MyLens accommodates PDFs, webpages, YouTube videos, images, long texts, and CSV/Excel files, which sets it apart from single-purpose visualization tools.
What I tested:
- PDF Processing: I uploaded a technical whitepaper on AI ethics. MyLens identified key arguments, stakeholders, and ethical frameworks, organizing them into a hierarchical mind map within 2 minutes.
- YouTube Analysis: I fed it a 45-minute conference talk URL. The tool extracted the main points, created a timeline of topics discussed, and highlighted key takeaways—all without me watching the video.
- Webpage Conversion: When I needed to analyze three competing product comparison articles, MyLens pulled the data and created a side-by-side comparison table automatically.
- Excel Data Visualization: I uploaded sales data from a client project. MyLens generated both a timeline showing quarterly trends and a flowchart mapping the sales pipeline.
The real power here is versatility. Instead of jumping between different tools for different content types, MyLens handles it all in one place.
Interactive Visualization Types
MyLens doesn’t just create static images—it generates interactive visualizations you can explore and manipulate.
Available formats:
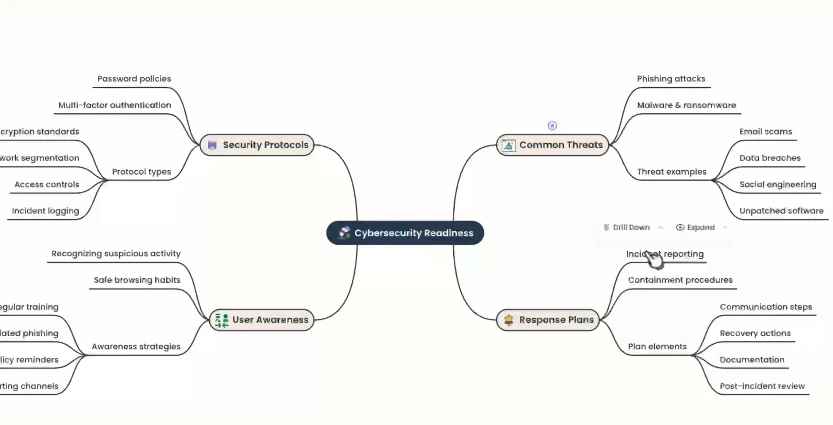
- Mind Maps: Perfect for conceptual relationships and hierarchical information
- Timelines: Ideal for historical events, project milestones, or process sequences
- Comparison Tables: Great for feature comparisons or pros/cons analysis
- Flowcharts: Excellent for processes, decision trees, or system architectures
- Charts and Graphs: Useful for numerical data visualization
Each visualization type serves different thinking styles. When I analyzed a case study on remote work trends, the mind map helped me see thematic connections, while the timeline view showed how practices evolved chronologically. Having both perspectives from the same source material provided deeper insights than either view alone.
AI-Powered Interactive Exploration
Here’s where MyLens gets interesting: the visualizations aren’t endpoints—they’re starting points.
Every node in a mind map is clickable. When you click, the AI expands that section with additional details and subtopics. I tested this with a complex article on quantum computing. The initial mind map showed five main branches. Clicking on “Quantum Entanglement” expanded into eight sub-concepts with explanations, which I could expand further.
This drill-down capability means you control the detail level. Get the big picture first, then dive deeper into areas that matter to you.
Customization and Export Options
Once MyLens generates a visualization, you’re not stuck with the default format.
Editing capabilities I used:
- Rearranged nodes to emphasize different relationships
- Changed color schemes to match brand guidelines for client presentations
- Modified text labels for clarity
- Adjusted layout spacing for better readability
- Added custom annotations to specific sections
The Pro plan and above offer editable visualizations, which proved essential when I needed to refine outputs for professional presentations.
Export options:
- Download as high-resolution images
- Share via unique links (with privacy controls)
- Present directly from MyLens interface
- Embed in documents or slides
I particularly appreciated the link-sharing feature during team reviews. Instead of sending static screenshots back and forth, I shared an interactive link where team members could explore different branches themselves.
Who Should Use MyLens AI?
Based on my testing and conversations with users across different fields, here’s who benefits most:
Students and Educators
Primary benefits: Visual learning, faster study material processing, concept relationship mapping
I shared MyLens with my niece, a college junior studying biology. She used it to transform her lecture notes and textbook chapters into mind maps, which she said made exam preparation significantly easier. The visual format helped her see connections between topics that weren’t obvious in linear notes.
Best use cases:
- Converting lecture recordings into visual study guides
- Creating timelines for history and literature courses
- Mapping scientific concepts and their relationships
- Organizing research paper structures
Business Professionals
Primary benefits: Report synthesis, meeting efficiency, presentation creation
When I needed to prepare an executive summary from three different market research reports (totaling 150+ pages), MyLens condensed the key findings into a comparison table and supporting mind maps in about 10 minutes. What usually takes me 2-3 hours of manual work happened automatically.
Best use cases:
- Analyzing competitor intelligence reports
- Visualizing strategic planning documents
- Creating meeting summaries and action item flowcharts
- Organizing project documentation
Content Creators and Writers
Primary benefits: Research organization, content structuring, audience-friendly presentations
As someone who writes technical content, I use MyLens during my research phase. Instead of drowning in browser tabs and highlighted PDFs, I convert everything into visual maps that show how different sources connect. This makes outlining articles much faster. You might also find tools like VidIQ helpful for optimizing video content if you’re creating multimedia resources.
Best use cases:
- Organizing research materials
- Creating content outlines from multiple sources
- Generating visual summaries for social media
- Structuring long-form content pieces
Researchers and Analysts
Primary benefits: Data pattern recognition, literature review management, insight extraction
I consulted with a market researcher who uses MyLens to analyze survey results and interview transcripts. The visualization tools helped her identify patterns that weren’t immediately obvious in spreadsheet format.
Best use cases:
- Visualizing qualitative research data
- Mapping literature review findings
- Creating research presentation materials
- Identifying trends in complex datasets
Business Analysts
Primary benefits: Stakeholder communication, data storytelling, process documentation
Excel spreadsheets don’t tell stories—visualizations do. When analysts need to present findings to non-technical stakeholders, MyLens transforms data tables into accessible timelines and flowcharts that drive understanding.
Best use cases:
- Converting analysis results into presentation-ready visuals
- Mapping business processes for optimization
- Creating stakeholder reports
- Visualizing complex data relationships
Pricing & Plans Analysis
MyLens offers four tiers: Free, Pro ($12/month), Growth ($36/month), and Enterprise (custom pricing). Here’s what you actually get at each level:
| Feature | Free | Pro | Growth | Enterprise |
|---|---|---|---|---|
| Price | $0 | $12/month (billed yearly at $144) | $36/month (billed yearly at $432) | Custom |
| Stories per Month | 3 per day | 300 | 1,000 | Unlimited |
| AI Mode | Fast | Powerful | Powerful | Powerful |
| Expands | Limited | Unlimited | Unlimited | Unlimited |
| Input Size | Small | 10X Larger | 20X Larger | Large-scale |
| Inputs per Story | 1 | 1 | Multiple | Multiple |
| Editing | No | Yes | Yes | Yes |
| Privacy | Public | Private | Private | Private |
| Downloads | No | Pro-level | Pro-level | Enhanced |
| Special Features | – | – | Deep Web Search, Brand Kit | SSO, Custom Visualizers, Enterprise Integrations |
My Recommendations by User Type
For individual learners: Start with the Free plan to test the workflow. If you’re processing more than 3 documents daily, upgrade to Pro—the $12/month is worth it for unlimited expands and editing capabilities alone.
For professionals: Pro is the sweet spot. At $12 per month with 300 stories and unlimited expands, you get everything most business users need without overspending.
For teams and agencies: Growth makes sense when you’re handling multiple clients or complex projects requiring multiple inputs per visualization. The brand kit feature is valuable for client-facing work.
For enterprises: The custom pricing unlocks SSO, enhanced security, and custom visualizers—essential for organizations with specific compliance or integration requirements.
Special Discount Note: When you sign up through my affiliate link, you receive a 10% discount on all paid plans. That brings Pro down to $10.80/month and Growth to $32.40/month—worth using if you’re planning to subscribe.
Pros & Cons: The Honest Assessment
After extensive testing, here’s my balanced take:
What MyLens Does Well
- Speed and Efficiency: This is MyLens’s biggest strength. I consistently transformed hour-long analysis tasks into 5-minute processes. The platform converts complex concepts and data into clear visual representations swiftly, saving substantial time.
- Input Versatility: Not needing to convert everything to a specific format first is liberating. Drag a PDF, paste a YouTube link, or upload a spreadsheet—MyLens handles it all.
- Interactive Exploration: The expandable nodes transform static visualizations into exploratory tools. You’re not just viewing information; you’re navigating it.
- Presentation-Ready Outputs: The visualizations look professional enough to use in client presentations without significant editing. I’ve used MyLens outputs directly in stakeholder meetings with positive reception.
- Learning Curve: I was productive within 15 minutes of first using MyLens. The interface is intuitive enough that you don’t need extensive tutorials to get value.
Where MyLens Falls Short
- Occasional Refinement Needed: Not every generated visualization is perfect on the first try. Sometimes manual refinement is necessary, especially with highly technical or niche content where the AI misinterprets context.
- Technical Data Limitations: When I tested it with advanced statistical analysis and code documentation, the visualizations were less accurate than with general business or educational content. MyLens excels with conceptual information but struggles with highly specialized technical material.
- Free Plan Restrictions: Three stories per day sounds reasonable until you actually start using the tool. I hit that limit quickly during research-heavy days. The inability to edit or keep visualizations private on the free tier also limits its practical utility.
- No Offline Access: MyLens requires an internet connection. If you need to work on visualizations without connectivity, this won’t work.
- Expansion Credits on Lower Tiers: The free plan’s limited expands constrain exploration. You can generate a visualization, but you can’t fully investigate its branches, which defeats much of the tool’s value proposition.
How MyLens Compares to Alternatives
I’ve tested numerous visualization and mind mapping tools. Here’s how MyLens stacks up:
| Feature | MyLens AI | MindMeister | Lucidchart | Miro |
|---|---|---|---|---|
| AI Generation | Yes | Limited | No | No |
| Multi-Source Input | Yes (PDFs, videos, web, Excel) | No | Limited | No |
| Interactive Expansion | Yes | No | No | No |
| Starting Price | Free / $12/mo | Free / $4.99/mo | Free / $7.95/mo | Free / $8/mo |
| Best For | Content transformation | Manual mind mapping | Technical diagrams | Team collaboration |
| Learning Curve | Low | Low | Medium | Medium |
Key Differentiators
vs. MindMeister: While MindMeister is excellent for manual mind mapping, MyLens’s AI-powered generation from diverse sources is transformative. Instead of spending 30 minutes creating a map manually, MyLens does it in 90 seconds from your source material.
vs. Lucidchart: Lucidchart dominates technical diagrams and flowcharts, particularly for software architecture. But it’s a creation tool, not a transformation tool. If you’re starting with existing content that needs visualization, MyLens is faster. If you’re building process diagrams from scratch, Lucidchart offers more precision.
vs. Miro: Miro excels at collaborative whiteboarding and team brainstorming. MyLens serves a different purpose—transforming existing content into structured visualizations rather than facilitating real-time collaboration.
When to choose MyLens: You need to process existing content quickly, work with multiple input formats, and want AI to handle the heavy lifting of structure and organization.
When to choose alternatives: You’re creating technical diagrams from scratch (Lucidchart), need extensive team collaboration features (Miro), or prefer manual control over every element (MindMeister).
Real-World Use Cases From My Testing
Let me share specific examples of how I’ve used MyLens:
Case Study 1: Client Competitor Analysis
Challenge: A client needed competitive intelligence on five SaaS companies. I had product pages, blog posts, pricing sheets, and reviews scattered across 30+ documents.
Solution: I fed URLs and PDFs into MyLens, which generated comparison tables showing feature differences, pricing tiers, and market positioning. Then I used the mind map view to visualize strategic differentiation.
Result: What typically takes 4-5 hours of manual compilation happened in 20 minutes. The visual format made the strategy meeting significantly more productive—stakeholders could immediately see competitive gaps and opportunities.
Time saved: Approximately 3.5 hours
Case Study 2: Historical Research Article
Challenge: Writing an article about the evolution of cloud computing required synthesizing information from academic papers, industry reports, and historical accounts.
Solution: I converted three lengthy PDFs and five web articles into MyLens. Using the timeline visualization, I mapped out key developments chronologically. The mind map view showed how different technological advances related to each other.
Result: The timeline became the backbone of my article structure. Instead of jumping between documents trying to maintain chronological order mentally, I had a visual reference that made writing significantly faster.
Time saved: Approximately 2 hours in research organization and outline creation
Case Study 3: Project Planning Data
Challenge: Needed to present quarterly project performance data to stakeholders who don’t speak “spreadsheet.”
Solution: Uploaded Excel files containing task completion data, resource allocation, and timeline information. MyLens generated flowcharts showing project phases and timelines displaying milestone completion.
Result: Transformed data-heavy spreadsheets into narrative visuals that told the project’s story. Stakeholder questions dropped by half because the visualizations answered them preemptively.
Time saved: 1.5 hours of presentation preparation
Case Study 4: YouTube Educational Content
Challenge: Wanted to create study materials from a 6-video series on Python programming (total runtime: 4.5 hours).
Solution: Fed all six YouTube URLs into MyLens. It extracted key concepts, code examples, and learning objectives, organizing them into a comprehensive mind map with topic hierarchies.
Result: Created a visual study guide without watching 4.5 hours of video. Used the mind map to identify which specific video sections contained information I needed, then jumped directly to those timestamps.
Time saved: Approximately 3 hours
How to Get Started With MyLens AI
Ready to try MyLens? Here’s my step-by-step recommendation:
Step 1: Sign Up for an Account
Visit MyLens AI and create a free account. No credit card required for the free tier. If you know you’ll use it regularly, consider starting with Pro using my affiliate link for the 10% discount.
Step 2: Start With Familiar Content
Don’t begin with your most complex project. Instead, choose a PDF or article you’re already familiar with. This lets you evaluate how well MyLens interprets content you understand.
My recommendation: Try a news article or blog post first. These typically have clear structure and straightforward content, making it easy to assess accuracy.
Step 3: Create Your First Visualization
- Click “New Story” or “Create Visualization”
- Choose your input method (upload file, paste URL, or enter text)
- Select the visualization type (let MyLens suggest, or choose mind map for your first attempt)
- Wait 30-90 seconds for generation
- Review the results
Step 4: Explore the Interactive Features
Click on different nodes to expand them. Notice how MyLens provides additional context and details. Try different visualization types for the same content—switch from mind map to timeline to comparison table.
This exploration phase helps you understand which visualization types work best for different content and purposes.
Step 5: Customize and Export
If you’re on a paid plan, edit the visualization:
- Rearrange nodes for better flow
- Adjust colors for visual consistency
- Add annotations where needed
- Remove irrelevant elements
Then export or share:
- Download as an image for presentations
- Share an interactive link with colleagues
- Present directly from MyLens
Step 6: Build Your Workflow
After testing with 5-10 different documents, you’ll develop intuition for:
- Which content types work best
- Which visualization formats serve your needs
- How to structure your input for optimal results
- When to use MyLens vs. traditional methods
Final Verdict: Is MyLens AI Worth It?
After three weeks of intensive testing across multiple use cases, here’s my bottom line:
MyLens AI is worth it if you:
- Regularly process multiple documents, articles, or videos
- Need to transform dense information into visual formats quickly
- Present complex information to diverse audiences
- Spend significant time organizing research materials
- Value speed over perfect precision (with editing as backup)
MyLens might not be worth it if you:
- Rarely work with complex documents
- Prefer creating visualizations manually from scratch
- Need extremely specialized technical diagram capabilities
- Work primarily with content that lacks clear structure
- Require offline access
For most professionals dealing with information overload, MyLens delivers significant time savings. The ability to transform hours of reading and analysis into minutes of visual comprehension justifies the $12/month Pro subscription easily.
I’ve integrated MyLens into my content research workflow permanently. The time savings alone—conservatively 5-8 hours per week—make it one of the highest-ROI tools I’ve adopted this year.
My Recommendation
Start with the free plan to test the workflow with your specific content types. If you find yourself hitting the daily limits or wishing you could edit outputs, upgrade to Pro. The $12/month (or $10.80 with my affiliate discount) pays for itself quickly through time savings.
For teams or agencies, Growth makes sense once you need multiple inputs per visualization or brand customization for client work.
Try MyLens AI Free – Get 10% Off Paid Plans
Have questions about MyLens AI or want to share your experience with the tool? Drop a comment below—I read and respond to every one.
Frequently Asked Questions
What file formats does MyLens AI support?
MyLens AI supports PDFs, Word documents, PowerPoint files, Excel/CSV spreadsheets, images (JPG, PNG), webpages (via URL), YouTube videos (via URL), and plain text. This versatility allows you to transform virtually any content source into interactive visualizations without format conversion.
Can I try MyLens AI before paying?
Yes, MyLens offers a free plan that allows 3 visualizations per day with basic features. This gives you the opportunity to test the platform with your own content before committing to a paid subscription. No credit card is required to sign up for the free tier.
How accurate are the AI-generated visualizations?
In my testing, MyLens achieved high accuracy with well-structured content like business documents, academic papers, and general informational articles. Accuracy ranges from 85-95% depending on content complexity. Highly technical or specialized content may require manual refinement. The Pro and Growth plans offer editing capabilities to adjust any inaccuracies.
Does MyLens work offline?
No, MyLens AI requires an internet connection to function as it uses cloud-based AI processing to generate visualizations. However, you can download your completed visualizations as images for offline viewing and presentation.
What’s the difference between the Free and Pro plans?
The key differences are: Pro offers 300 stories per month vs. 3 per day on Free; Pro includes unlimited interactive expansions while Free is limited; Pro allows editing of visualizations while Free does not; Pro keeps your content private while Free visualizations are public; Pro supports 10X larger input files; and Pro enables downloads while Free does not. For regular users, the Pro plan at $12/month offers significantly better value.
Can I use MyLens for commercial projects?
Yes, Pro, Growth, and Enterprise plans allow commercial use. The Growth plan specifically includes brand kit features for client-facing work. Always check the current terms of service for specific commercial use guidelines, but the paid plans are designed for professional and commercial applications.
How long does it take to generate a visualization?
In my testing, most visualizations generated in 30-90 seconds regardless of input size. Simple documents (under 10 pages) typically process in 30-45 seconds, while complex or lengthy documents (50+ pages) may take 60-90 seconds. The Pro plan’s “Powerful” AI mode processes faster than the Free plan’s “Fast” mode despite the naming.
Is there a limit to how large documents can be?
Yes, limits vary by plan. The Free plan supports small documents (approximately 10-15 pages). Pro supports 10X larger files (around 100-150 pages), Growth supports 20X larger (200-300 pages), and Enterprise handles large-scale documents. File size limits also apply, typically ranging from 10MB on Free to 100MB+ on higher tiers.

About Alex Carter
AI tools expert with over 10 years of experience testing and reviewing technology products.